Page 113 - Tallinn University
P. 113
HARIDUSTEADUSED Tallinna Ülikooli üliõpilaste 2015/2016. õppeaasta PARIMAD TEADUSTÖÖD / Artiklite kogumik
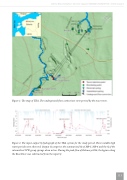
Figure 1. e map of TKA. e underground ow connections were proved by the tracer tests.
Figure 2. e input-output Q hydrograph of the TKA system for the study period. ree notable high water periods were observed. Output Q comprises the summarized Qs of MP-5, MP-6 and the Q of the intermittent WW group springs when active. During the peak ow of February 2016, the bypass along the Kuie River was substracted from the input Q.
113